
With the Elastic released of version 8.17.0, it included “The technical preview of new MATCH and query string (QSTR) functions in ES|QL makes log searches easier and more intuitive.”[1] With this released, I started exploring some of the many options available with ES|QL in Kibana [2], enabled by default, to do various types of queries to quickly summarize data, outside of the default or custom dashboards.
To illustrate this, I will show two different queries, one with user.name and one with source actor IP addresses. While writing the query, you will notice after you include the pipe (|), a list of possible ES|QL field options will appear, refer to this reference for ES|QL language [4].
This is an example of a simple strategy where the only field selected is the user.name stored in the Elasticsearch [6] cowrie table. In this example, the output is limited by time and up to 1000 rows. By adding | LIMIT 10 to the end of the query, the output would only show the TOP 10 vs. up to 1000.
FROM cowrie*
| KEEP user.name
| STATS COUNT(user.name) BY user.name
| SORT `COUNT(user.name)` DESC
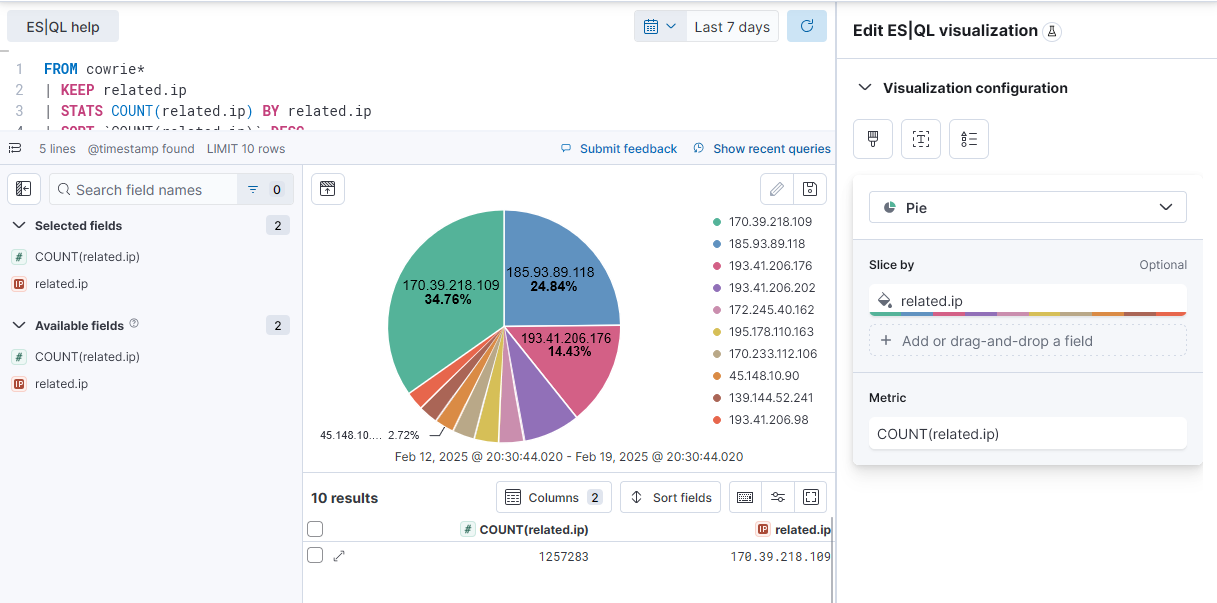
This second example shows the Top 10 Actor IPs over the past 7 days captured by DShield Sensor. To change the default visualization, this include changing the visualization type, axes and colors, click the pencil button (esql icon in above picture). It will open the in-line editor like this example where you can manipulate the graph to what you want.
FROM cowrie*
| KEEP related.ip
| STATS COUNT(related.ip) BY related.ip
| SORT `COUNT(related.ip)` DESC
| LIMIT 10
This is another way of working and manipulating data in Kibana with ES|QL to explore the data. You can check out this reference [2] where there are several examples of how you can start exploring the data in other fun ways.
[1] https://www.elastic.co/blog/whats-new-elastic-8-17-0
[2] https://www.elastic.co/guide/en/elasticsearch/reference/8.17/esql-kibana.html
[3] https://www.elastic.co/guide/en/elasticsearch/reference/8.17/esql-using.html
[4] https://www.elastic.co/guide/en/elasticsearch/reference/8.17/esql-functions-operators.html
[5] https://github.com/bruneaug/DShield-SIEM/tree/main
[6] https://isc.sans.edu/diary/DShield+SIEM+Docker+Updates/31680/
———–
Guy Bruneau IPSS Inc.
My GitHub Page
Twitter: GuyBruneau
gbruneau at isc dot sans dot edu
